|
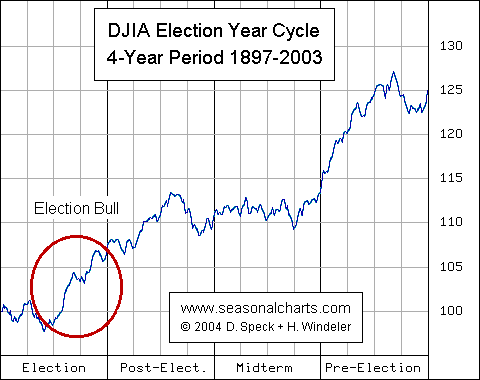
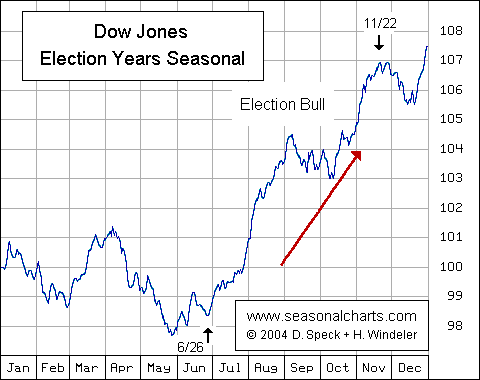
Financial markets are following a 4-year cycle, that is caused by the US Presidential Elections: Policy and monetary policy are determined by the election date. The chart above depicts the average 4-year course of the Dow Jones over approx. 100 years. Typically, the second half of an election year is strong. The 'Election Bull' is the cyclical increase in the Dow Jones in the second half of an election year, starting on June 26 and ending on November 22. The following chart shows the election year enlarged: 
The 'Election Bull' lasts 149 calendar days, resulting in an average increase of 8.8 %. But there are also exceptions, election years with falling stocks. Thus it is always necessary to take steps to minimize losses (e.g. through stopp loss). Please find also other markets in the course of the 4-year election cycle under SPECIALS: 4-Year Election cycles. Notice: Our Hot Tips are no trading recommandations. In fact, they are a real time test of seasonal patterns. Trading with seasonality requires additional means to reduce losses, for example diversifaction, the implemetantion of further indicators, or stop losses. Yoy can find an introduction into seasonal trading under trading strategies. Please take also notice of the results of our previous tips and of our disclaimer. |