Seasonality is a seasonal fluctuation or cycle forming a trend or pattern. The best-known seasonal pattern is that of the outdoor temperature. Markets also demonstrate seasonal tendencies or trends i.e., the year-end rally in the stock market or low heating oil prices during the summer. There are a number of various reasons for these seasonal patterns, for example: the weather itself, harvest periods, the heating season, interest payments (i.e. at year end), investor sentiment during certain times of the year (i.e. in autumn), yearly or quarterly financial reporting of companies or investment funds.
Our seasonal charts show the average trend of the past several years. The time axis is scaled in months, the vertical axis shows the relative value change compared with 100. The end-value of each chart shows the average trend development over the corresponding years. Our charts offer to-the-day displays and exact percentage values.

|
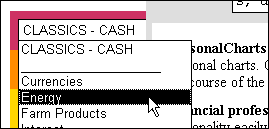
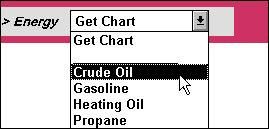
1. Please choose a group on the left |

|
|
For personal use, our charts can be used free of charge. However, they may not be arbitrarily published or used on the Internet. More about the public use of our charts: obtaining charts.
- Right mouse click on the chart
- Select save as
- Choose or enter directory and/or file name
- Click OK
Seasonal charts do not need to be updated as frequently as normal price charts. Seasonal charts are calculated from an average of prices spanning i.e., 30 years. There is for instance only a small noticeable difference when two years are added to a chart calculation.
You may be using a pop-up window blocker that should only block ad windows. Allow the blocker to open pop-ups on the SeasonalCharts.com website. (Adjust accordingly the options in your browser, firewall or pop-up blocker).